POS - Back Office: Dashboard
![]() Updated
Updated
POS BackOffice: Dashboard
The Dashboard is the default home page for Cultivera POS. It shows a running tally of Sales, Returns, Taxes, Discounts, Cash Redemption, and Orders in boxes at the top of the screen.
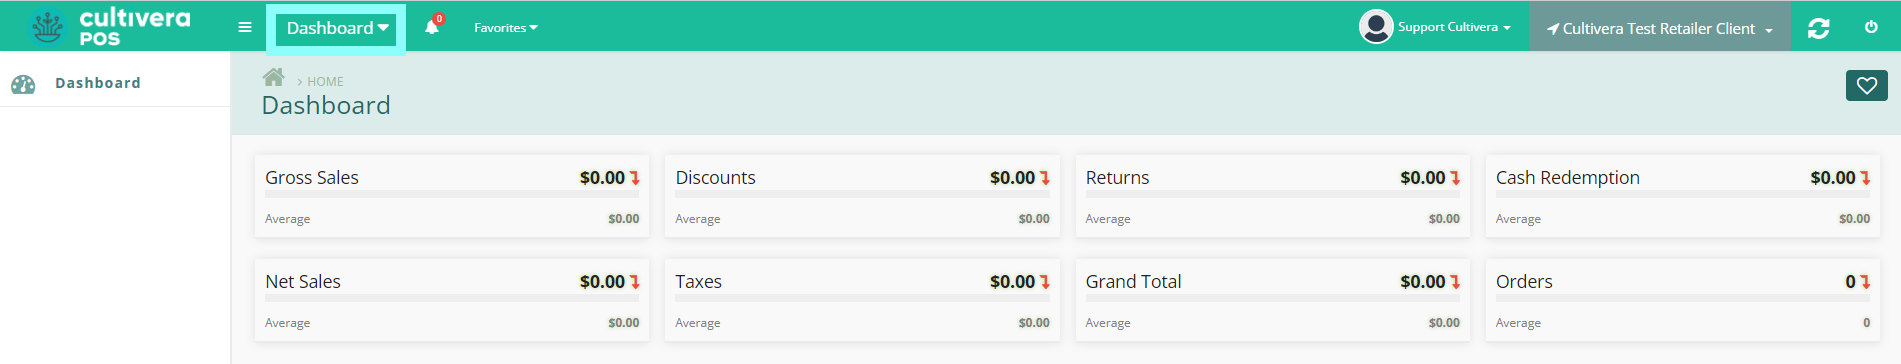
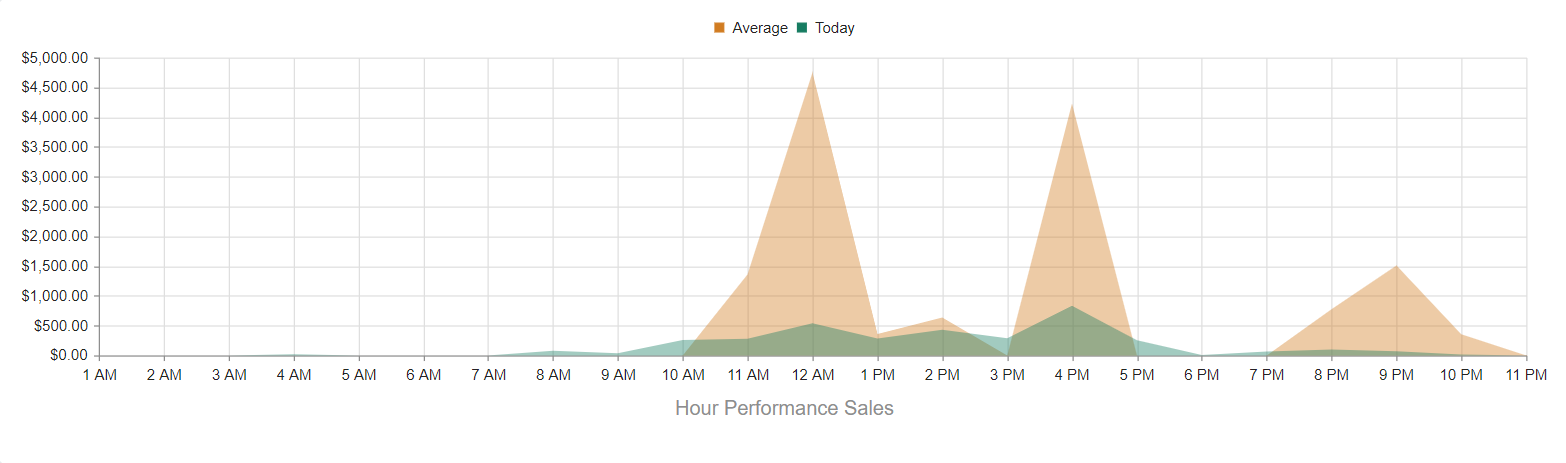
Just below, there is a chart that measures Hourly Sales Performance as well as the Average Sales for that day of the week.
As you scroll down the page you are able to see the five Latest Actions performed in the system by all users. There is also a pie chart that shows a percentage of product Most Sold Categories.
Next, a summary of Incoming Transfers and Daily Customer Sales Performance is displayed.
Incoming Transfers show a list of pending transfers and their expected dollar values. Clicking on any Pending Transfer will take you to the transfer details page. The Daily Customer Sales Performance chart shows the total sales over the past week broken down by day.
Lastly, there is a bar graph showing Weekly Sales For The Last Three Months. This displays a dollar value for the last 14 weeks.
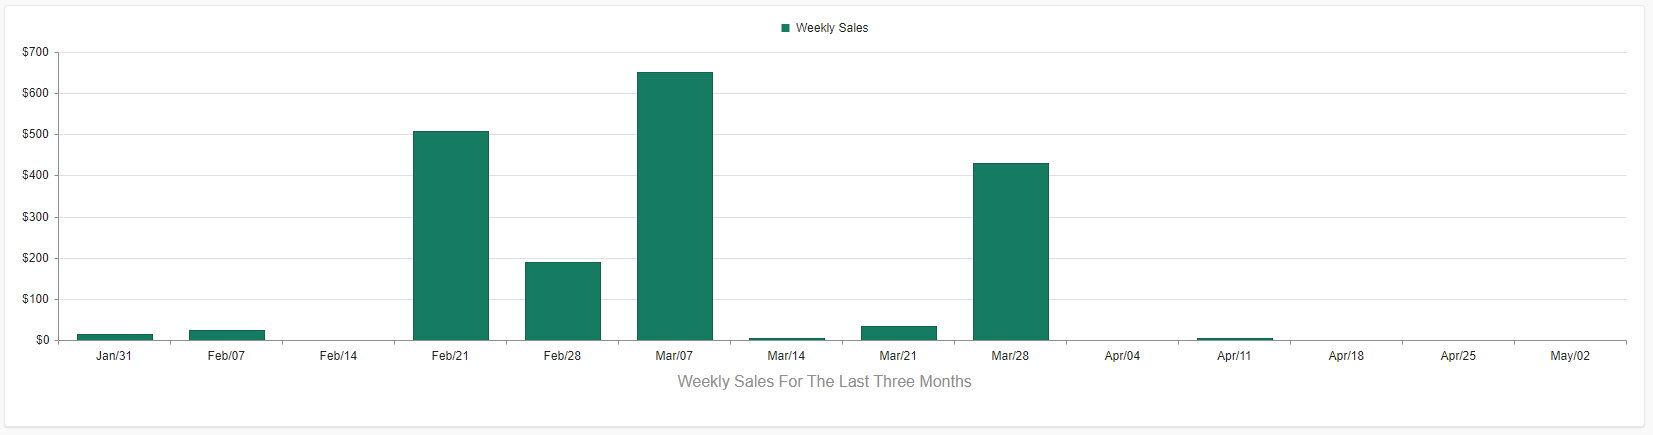
The Dashboard is a great way to get an "At-A-Glance" insight on sales and transfer information.