PRO: Using Excel to Capture Analytics Report Data
![]() Updated
Updated
Using Excel to Capture Analytics Report Data in Cultivera Pro
The reports contained within the Analytics module of Cultivera Pro are compiled from multiple data sources that have been compiled and formatted to display as a static page.
This article will demonstrate how to extract the data from Cultivera Analytics reports using the Windows Snipping Tool and the Data menu in Microsoft Excel.
The first step will be to navigate to the Analytics module from the main menu in Cultivera Pro, which will land you on the Dashboard page.
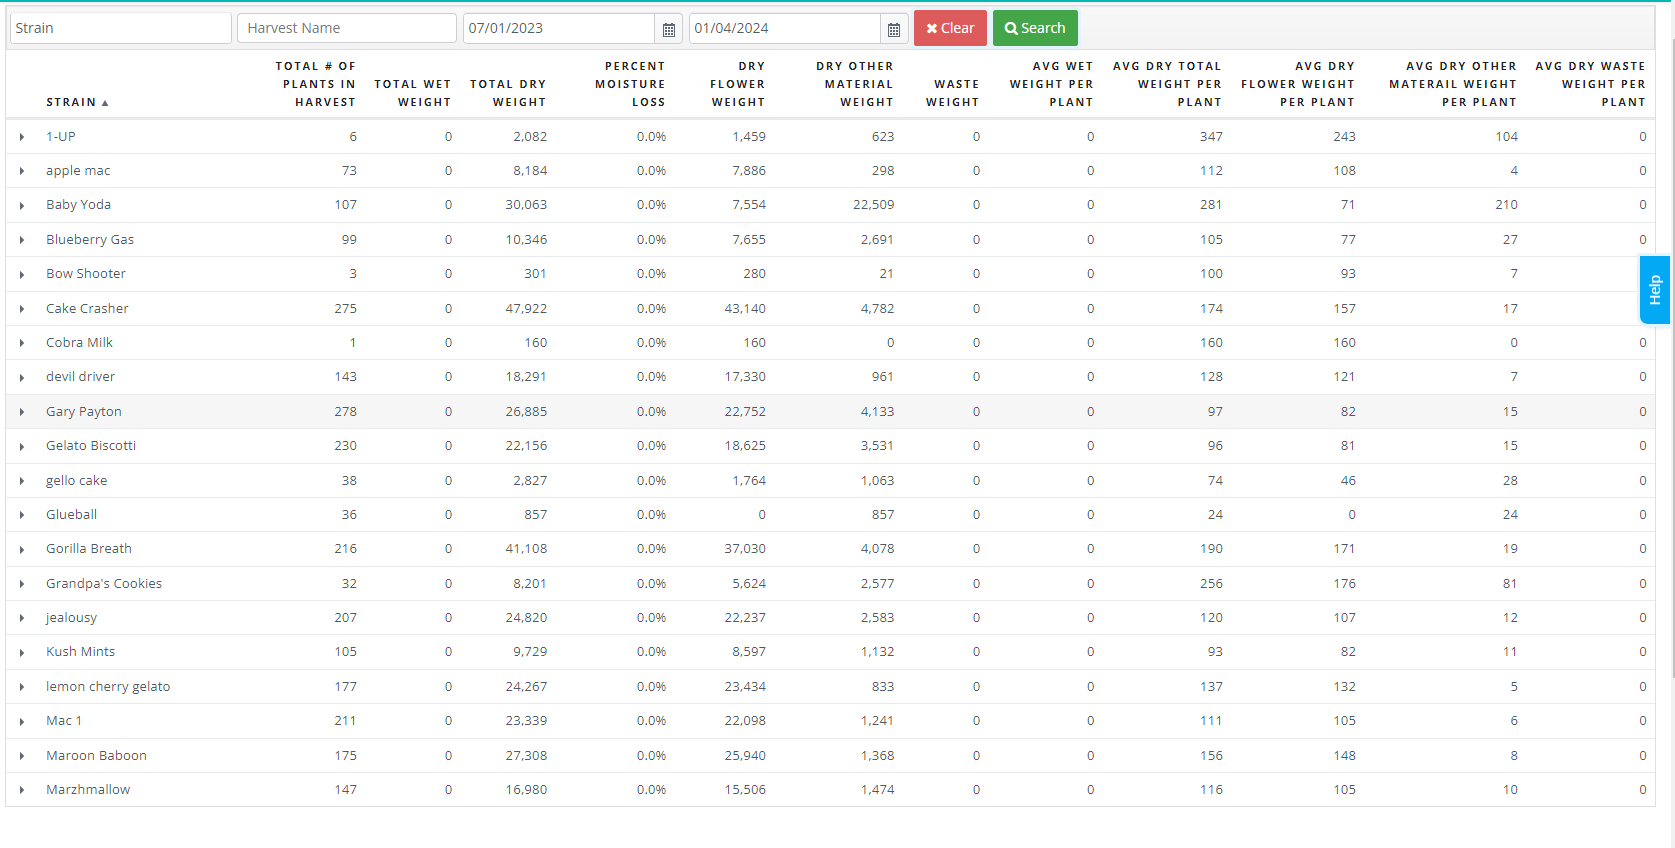
From here, select a report and set the appropriate filter criteria, as needed, to run the report. In the following example, we use the Harvest Yield report, filtered by a specific range of dates.
- In Windows, hold the SHIFT + WINDOWS keys and tap the letter S on the keyboard to launch the Snipping Tool.
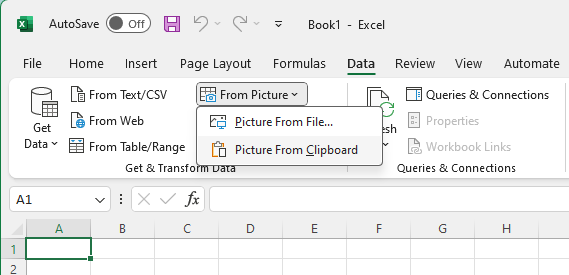
You will see your mouse pointer turn into a cross shape for selecting the portion of the screen you'd like to capture. Drag the mouse pointer across the entire section of the screen you'd like to capture. At this point, the image will be copied to the clipboard and you should see an alert a the bottom right corner with a thumbnail image preview. - Open Excel to a blank workbook. If you were to simply Paste the image from your clipboard, it would be inserted as a graphic, which is not as useful as the raw data. Instead, select the Data menu, "From Picture", then "Picture From Clipboard".
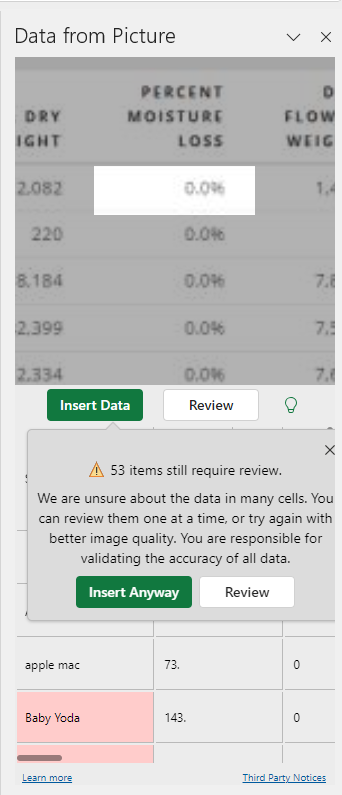
- You will see a data validation window on the right side of the Excel window that shows a preview of the data with options to either "Insert Data" or "Review".
You will want to use the "Review" to validate any questionable fields that the software needs help interpreting properly.
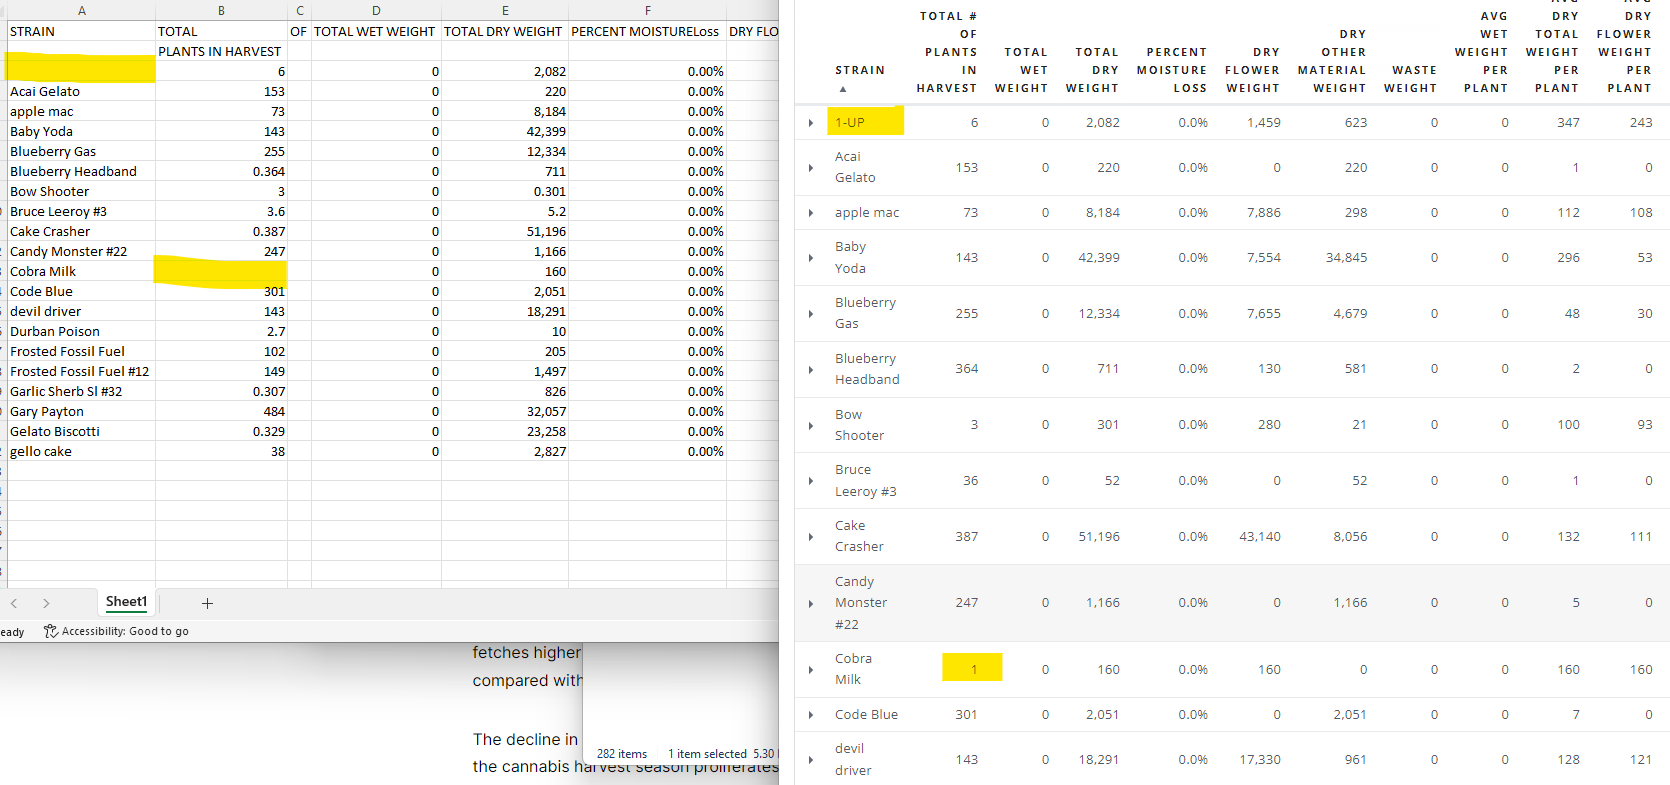
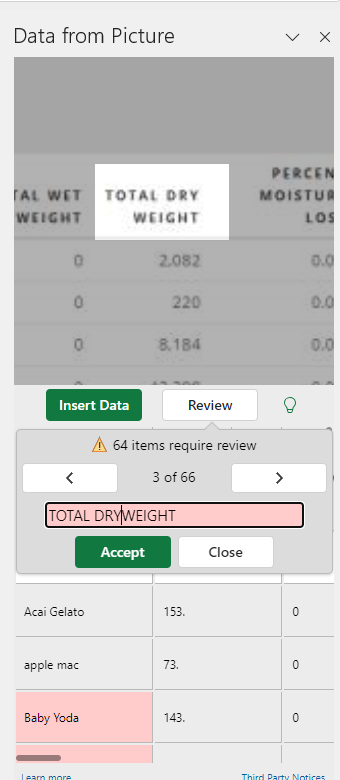
All of the fields that need to be checked will be highlighted with shading, but when you click "Review," the software will take you through each cell in question, one by one, so that you may manually check that the correct data is entered and column headings translated properly.
In our example here, it is ideal to insert some spaces in the column headings to make them more readable.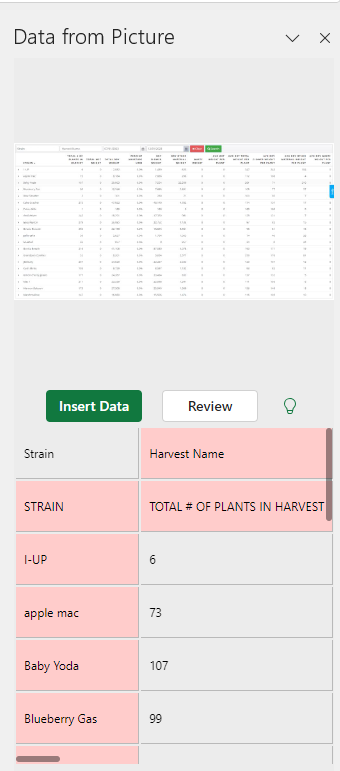
Here is an example of what Excel will show while reviewing cells.
- When you are ready, choose "Insert Data" and be aware that, if you didn't already check each item the system will remind you how many still need checking, at which point you could continue to "Review" or "Insert Anyway" and make any remaining corrections in the next step.