Cultivera Exchange (Seller): Manage Selling - Dashboard
![]() Updated
Updated
Manage Selling - Dashboard
This guide covers the Seller Dashboard within the Cultivera Exchange. This page serves as your primary analytics hub, providing a real time overview of your sales performance, inventory health, and required administrative actions.
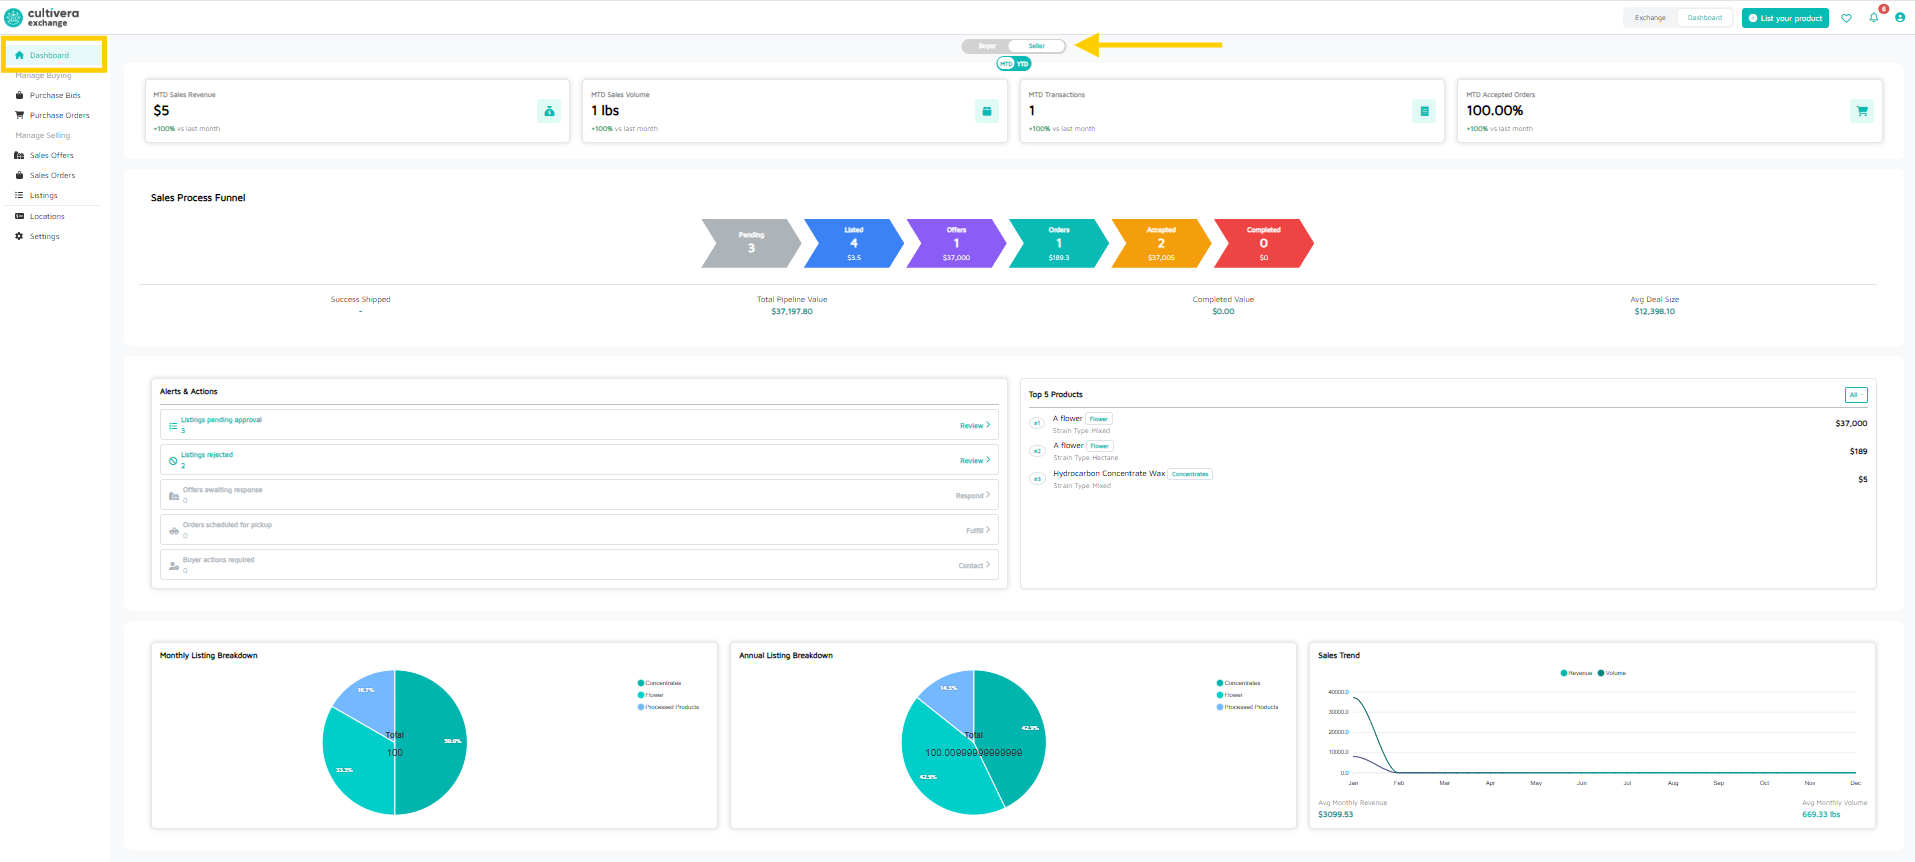
Key Performance Indicators (KPIs)
At the top of the dashboard, you will find four primary metrics. You can toggle these between MTD (Month-to-Date) and YTD (Year-to-Date) views.

- Sales Revenue: Total dollar amount of completed sales.
- Sales Volume: Total weight of product sold.
- Transactions: The total number of orders processed.
- Accepted Orders: The percentage of incoming offers you have accepted.
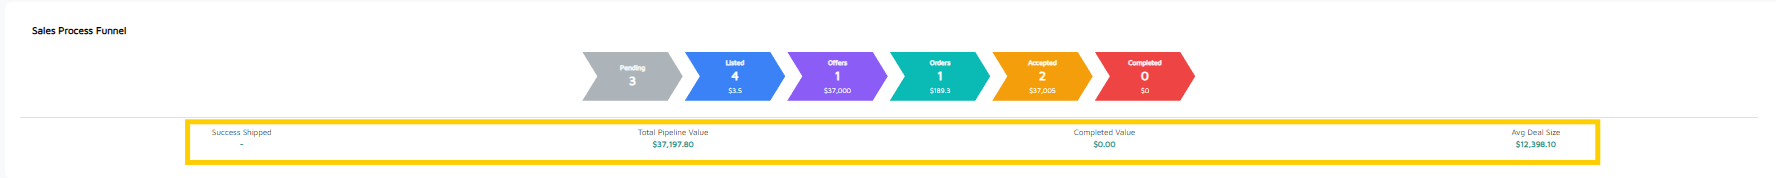
Sales Process Funnel
This chart tracks your inventory as it moves through the Cultivera Exchange lifecycle:
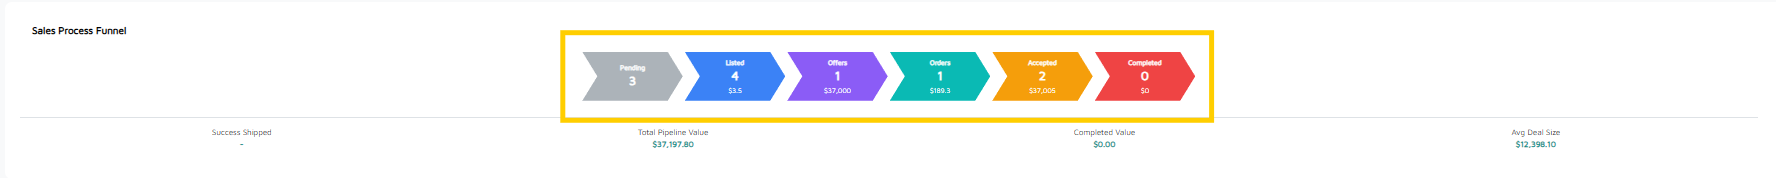
- Pending: Listings currently being reviewed by Mello Admins.
- Listed: Active products visible to buyers and their total market value.
- Offers: The value of active bids currently being negotiated.
- Orders: Transactions that have moved past the offer stage but aren't yet finalized.
- Accepted: Orders confirmed and awaiting fulfillment/transport.
- Completed: Successfully delivered and paid transactions.
Alerts & Actions
This is your "Daily To-Do List." Items appearing here require immediate attention to keep the sales process moving:
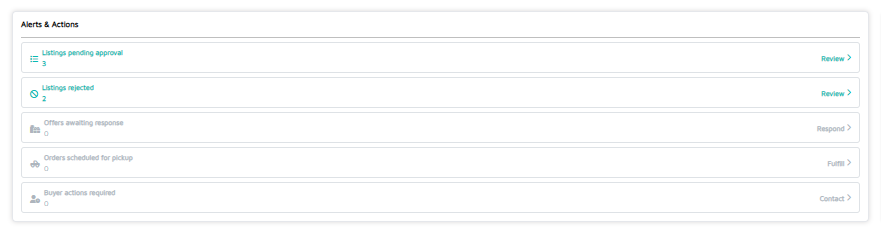
- Listings pending approval: New listings waiting on Mello Admin review.
- Listings rejected: Listings denied by Mello Admin.
- Offers awaiting response: New bids from buyers.
- Orders scheduled for pickup: Logistics tasks for upcoming deliveries.
- Buyer Actions Required: Any actions needing attention from the buyer.
Top Picks
This list ranks your best performing inventory by total revenue.
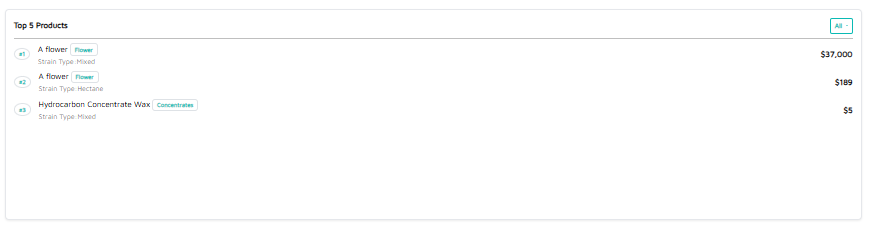
- Usage: Use this to identify which strains or product types are currently in high demand so you can adjust your cultivation or production focus.
Inventory & Sales Trends
The bottom section provides visual data on your Cultivera Exchange footprint:
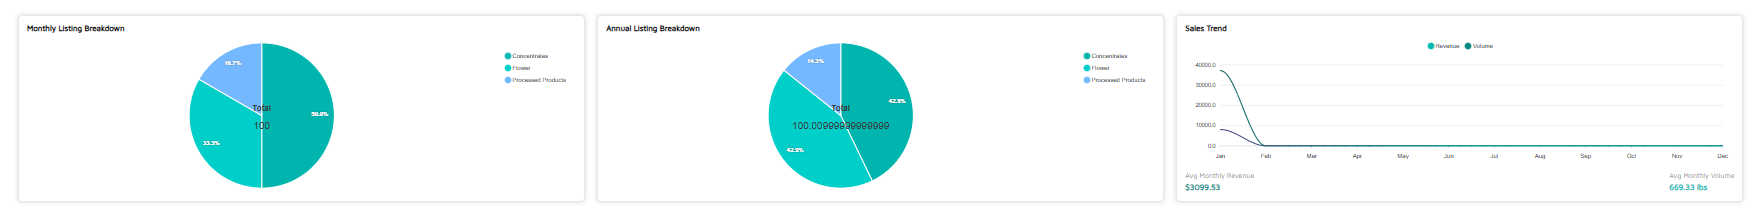
- Monthly/Annual Listing Breakdown: Pie charts showing the diversity of your inventory categories.
- Sales Trend: A line graph comparing your Revenue vs. Volume over the calendar year.